CLAUDE TRADING DASHBOARD
Options Trading • AI-Powered • Live Monitoring
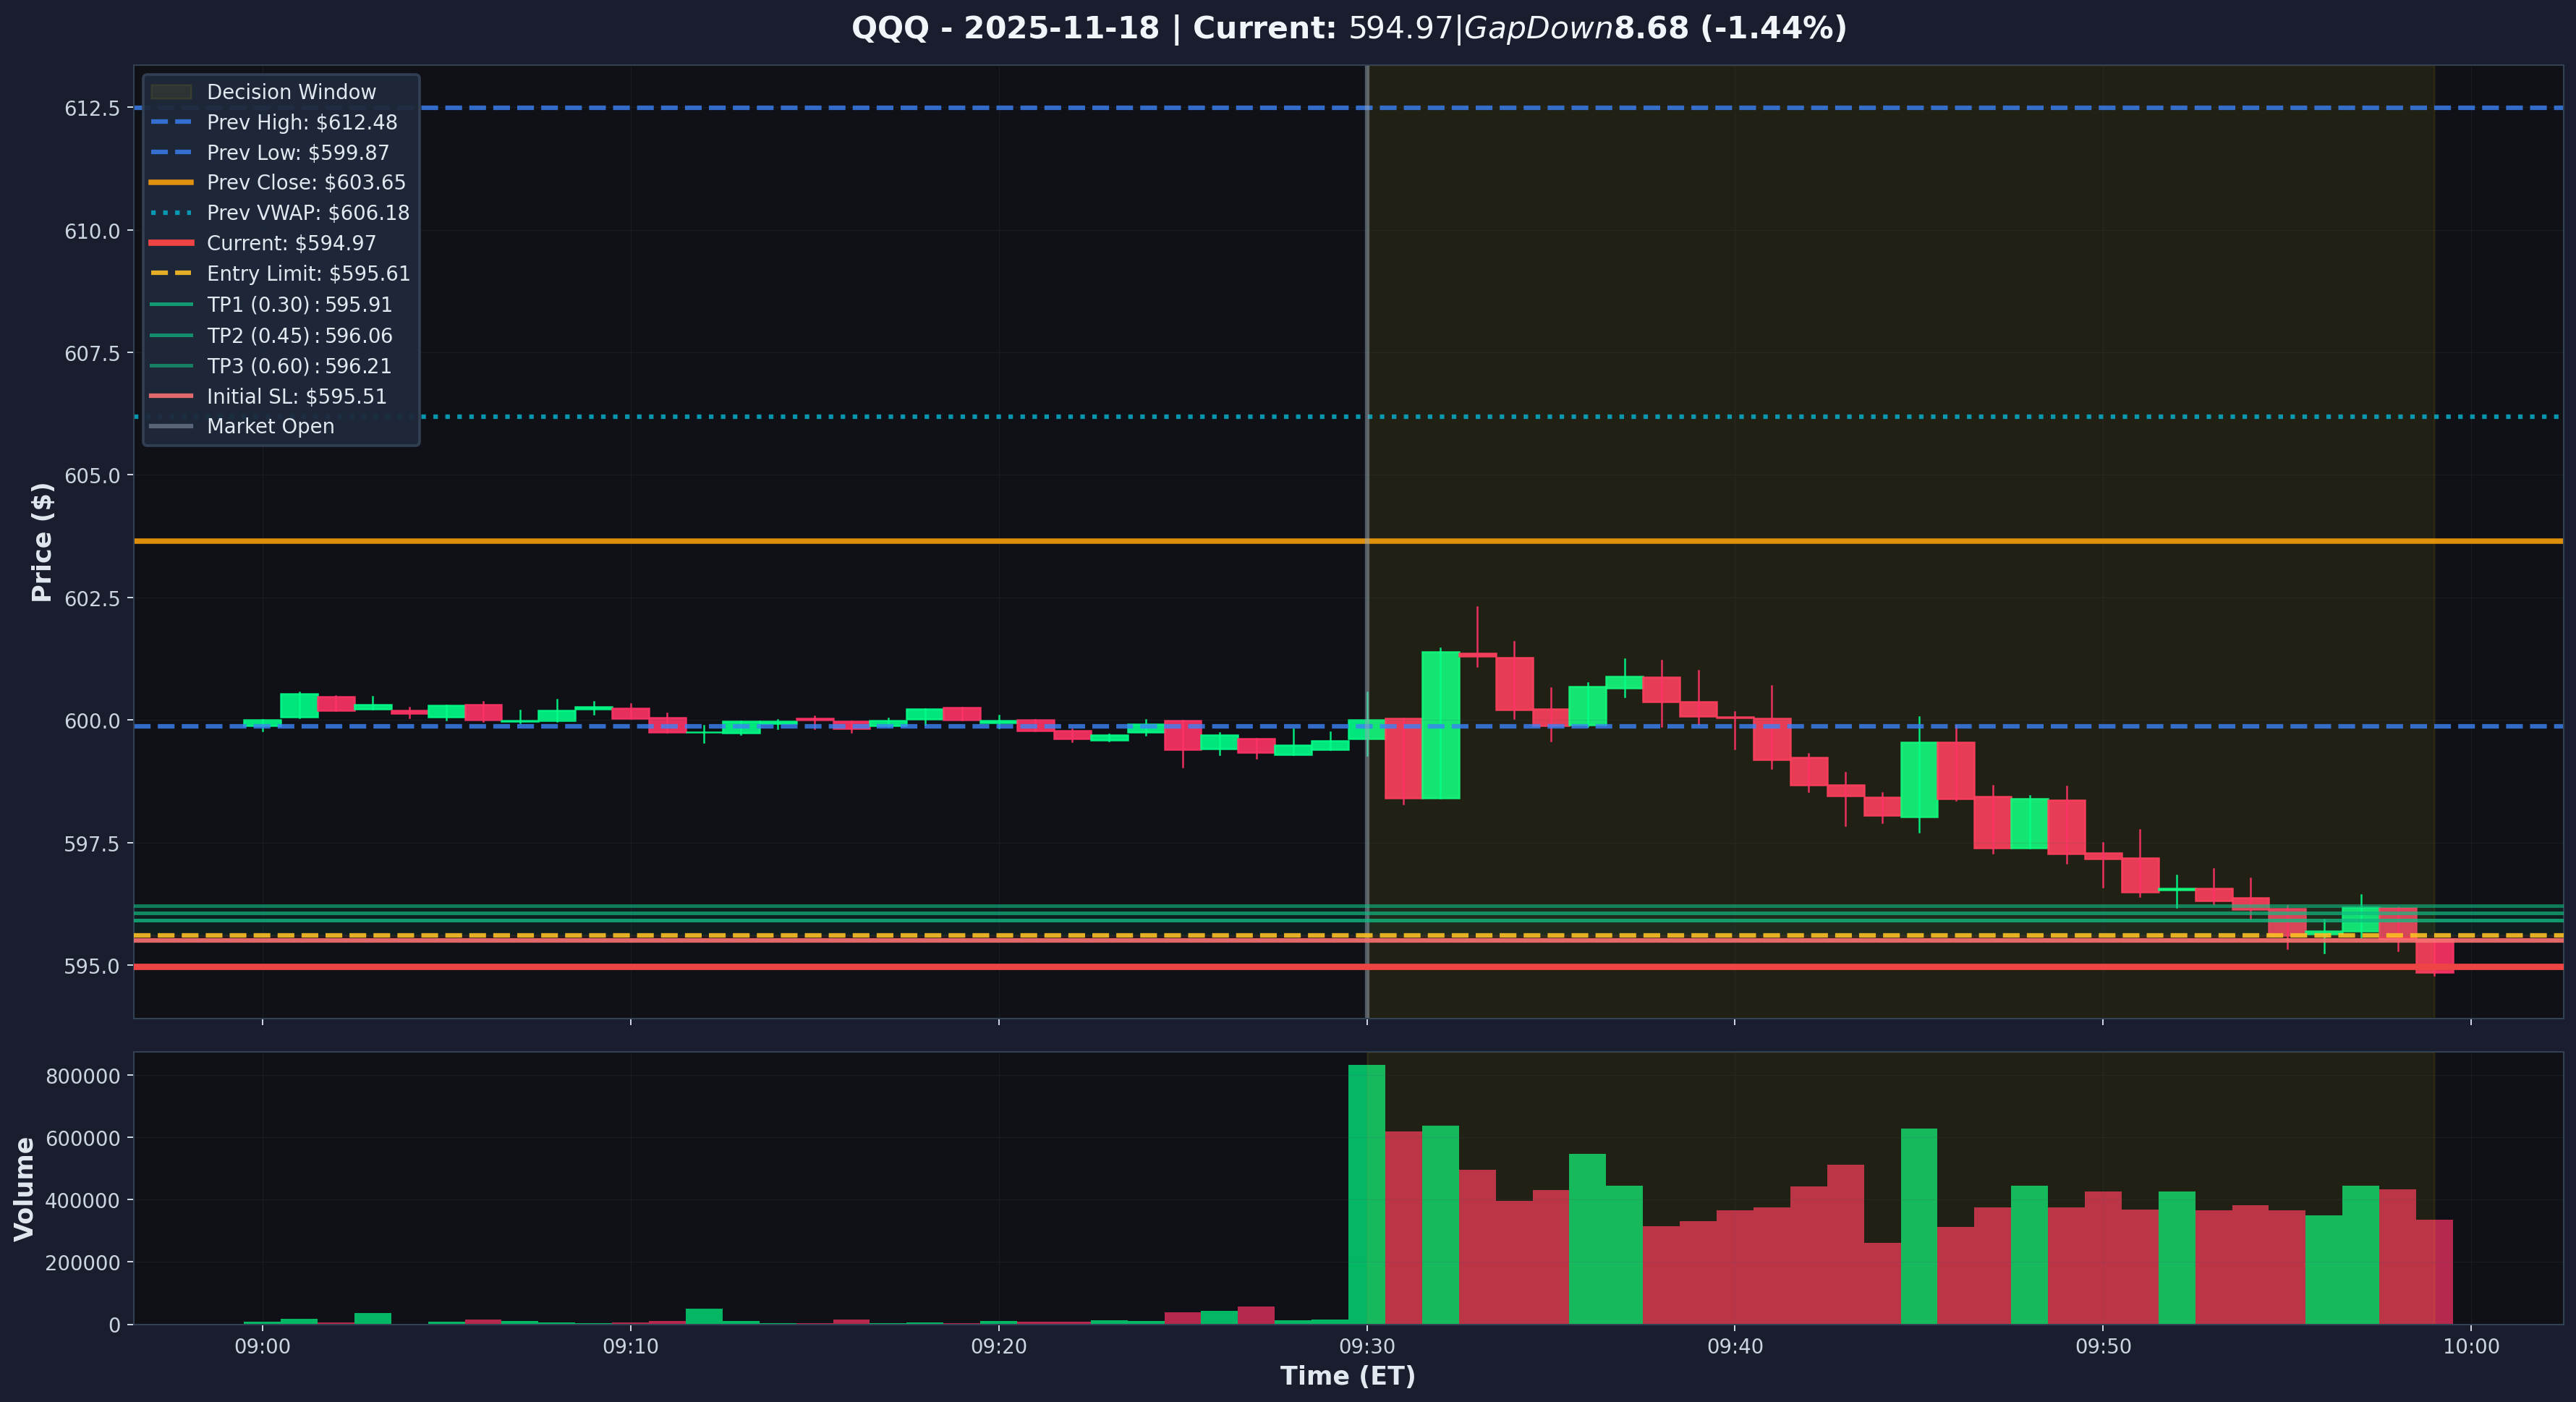
📈 Trading Chart

📊 Account Overview
Starting Equity: $30,000.00
Portfolio Value
--
Cash Available
--
Today's P&L (Alpaca)
--
Today's Return
--
Note: "Today's P&L (Alpaca)" shows your actual account change including fees.
The "Today" value below in Performance Highlights is calculated from your trade logs and may differ slightly.
🎯 Performance Highlights
Today (from logs)
--
This Week
--
This Month
--
Trading Days
--
Win Rate
--
Total P&L (Real)
--
Expectancy/Day
--
Best Day
--
Worst Day
--
Avg Win/Day
--
Avg Loss/Day
--
Profit Factor
--
(Total Wins ÷ Total Losses)
Total Return
--
(From Starting Equity)
Sharpe Ratio
--
(Risk-Adjusted Return)
Max Drawdown
--
(Worst Peak-to-Valley)
Current Streak
--
--
📈 Trade History (Last 50 Days)
Note: Each row = one trading day with all scaled exits combined.
"Exits" column shows how many partial exits (TP1, TP2, TP3, etc.) were taken.
"Acct %" shows the P&L as a percentage of your account value at that time.
| Date/Time | Option | Dir | Entry | Last Exit | Total Qty | Total P&L | Return | Acct % | Exits | Reasons |
|---|---|---|---|---|---|---|---|---|---|---|
| Loading trades... | ||||||||||
📋 Recent Orders (Alpaca)
| Time | Symbol | Side | Quantity | Fill Price |
|---|---|---|---|---|
| Loading orders... | ||||